This week I am continuing to work on a program that will generate synonymous changes based on local base-pairing probabilities. Currently, my program can run and recognize Mfold inputs and outputs. My next goal is Rfold integration and, therefore, synonymous change generation.
|
This week I made synonymous changes to the first 100 nucleotides of a sequence when the local base-pairing probability was above 0.1. I repeated this 100 times. Next, I ran each of these 100 sequences (with different synonymous changes) through my program that determines the folding energy and averaged the results. Then, I put these sequences back into the original sequence and run these 100 sequences through my program and averaged the results as well. Finally, I repeated this process for sequences of length 50 and 25 and created a graph (below) to represent the data. 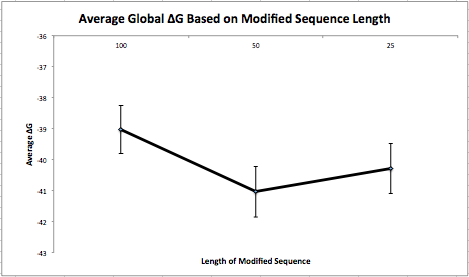 It is important to note that I made the synonymous changes on the same (first) 100/50/25 nucleotides of the sequence and not on random pieces throughout the sequence. I also reverted back to the original piece when making modifications instead of keeping changes that minimized the folding energy. My next experiment will take random pieces throughout the sequence and will put the modified piece back if the changes are advantageous.
This experiment took a great amount of time and effort. I had to make synonymous changes by hand and run my program more than 400 times. To minimize both the workload and time, another research student and are working on developing a program that can generate synonymous changes based on a local base-pairing probability specified by the user, given a Rfold output file. This week I have been continuing my folding energy experiment. After my initial experiment, I have been repeating it about 100 more times. After I am finished I will average these results together. Next, I will repeat this experiment but change the threshold from greater than or equal to 0.1 to several different thresholds and repeat those experiments 100 times and average the results. Then, I will create a graph based on my results to show the effect of base-pairing probabilities on folding energy. Currently, I plan to either use GNU Plot or Microsoft Excel to generate the graphs.
I also plan to modify the length of the selected modified sequence from 100 to 75, 50, and 25. I will repeat each experiment 100 times respectively and also plan to generate graphs to visually represent the resulting data. Within the past week, I have finished my Perl program (for now) that runs Mfold and calculates and directly outputs the folding energy. Using this program, I calculated the energy of a specific sequence and got ∆G=-41. Next, I took the first 100 nucleotides and calculated the folding energy for this piece and got ∆G=-5.2. Then, I used Rfold to calculate the local base pairing probabilities for the 100 nucleotide piece and made synonymous changes that involved the nucleotides with a probability greater than 0.1. I ran this modified 100 nucleotide sequence through my Mfold Perl program and found that the folding energy changed to -13.8 now. Finally, I put this modified sequence back into the original whole sequence and recalculated the folding energy and found that ∆G=-38.4. The results are shown in the table below. Now I plan to repeat this experiment several times (~100) to see how consistent my results are. After I do this, I will modify the threshold as well as the size of the piece and see how these changes affect my results. I also plan to repeat these experiments several times. 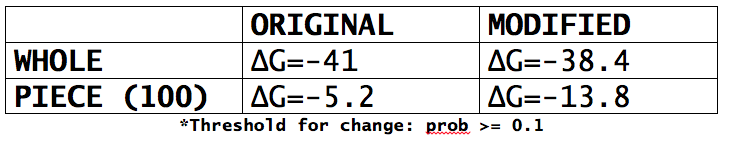
|
JAY VillariUndergraduate student studying Computer Science and Biology at The College of New Jersey Archives
May 2016
Categories |
 RSS Feed
