I have also gained experience in many other facets of computational research. I learned bash scripting and its applications as well as common ways to configure, install, test and run different (usually biologically related) software. In addition, I have learned more about GNUPlot and how to alter different things. I have figured out how to add x and y axis labels as well as how to add and label a line through all of the data points.
This week I have made modifications to my program to slightly alter its function. I have made so that, instead of making synonymous changes to all positions above a specified threshold, it only makes a synonymous change to a single position. It then keeps that change, reruns the local sequence in rfold, and makes another single change. Currently, my program iterates 40 times. Below are the results graphed with GNUPlot: 
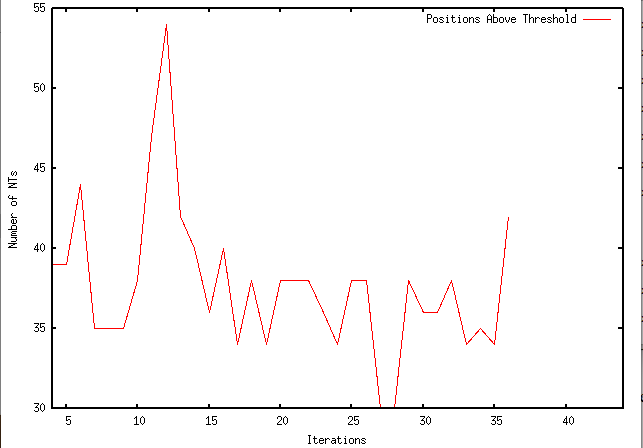
As you can see, the number of nucleotides that exist above the threshold does fluctuate, but generally begins to minimize until the last iteration, in which it suddenly increases to 42 nucleotides above the 0.1 threshold. I aim to experimentally determine the number of iterations that provides the largest decrease in number of nucleotides above the threshold while minimizing the iterations.
I have also gained experience in many other facets of computational research. I learned bash scripting and its applications as well as common ways to configure, install, test and run different (usually biologically related) software. In addition, I have learned more about GNUPlot and how to alter different things. I have figured out how to add x and y axis labels as well as how to add and label a line through all of the data points.
0 Comments
This week I have adapted my program to run on the Ubuntu lab computer. I configured and installed Mfold, Rfold, and UNAFold to allow my program to perform system calls. Now, instead of using an rfold file that already exists in a directory, my program can make calls directly to rfold (several times) and generate the necessary files itself (for a short synopsis of my program subroutines, see below). Later today, I will upload additional graphs of the data my program has generated.
importGlobalSequence -> Imports the sequence calcFoldingEnergy -> Calculates Folding Energy using Mfold importLocalSequence -> Selects a K-mer generateRfoldFile -> Generates Rfold Probability File createArrOfPosAboveThreshold -> Creates array of prob. above threshol modifySequence -> Modifies the sequence generateModifiedFastaFile-> Saves the modified Fasta Sequence synonymousChange-> Creates a synonymous change This week I configured and installed GNUPlot so that I can create comprehensive graphs of my results. My first graph, which shows how the global ∆G changes with local modifications with a window size of 100 and a threshold > 0.1, is shown below. However, it does not only show the changes that were advantageous, but also the changes that were't kept (or used towards optimization).
This past month I have made significant progress to my program. Aside from small modifications, it is near completion. First, it imports the global sequence from a given FASTA file. Next, it calculates the folding energy. Then, it prompts for input of the local sequence length and picks a random piece of that length from the global sequence. Following that, it prompts the user for a threshold and uses a generated Rfold file to generate various arrays that contain the positions in the local sequence that are above a certain threshold. Using these arrays, it makes synonymous changes in the positions that are above the given threshold and then inserts the modified local sequence back into the global sequence. Finally, it reruns mfold on the modified global sequence and compares the two output and keeps the modified sequence if it's ∆G is less the original global sequence's ∆G. Currently, I am running this program and creating graphs and other forms of visual data to document my results.
This week, I have been very busy with finals and end-of-semester projects, so I have not had much time to advance my research progress. However, with the time I did have, I integrated my two programs into one. Currently, it takes a FASTA and Rfold file as input, and uses the local base-pairing probabilities to make synonymous changes at the sites that are above a specified threshold.
In the coming weeks, I plan to modify the program to take only a piece of the sequence (with a parametrized length) and make synonymous changes on that piece only. Then, if the changes reduce the folding energy, the program will keep that change and if it does not it will not. I also plan to improve the algorithm that makes the synonymous changes to make it more efficient. This week I developed two programs to facilitate the development of my final program. The first program makes synonymous changes to a sequence extracted from a FASTA file. It does so by creating an array of codons in the sequence and modifying each codon with a synonymous one.
The second program takes an Rfold file as input and creates an array of nucleotide positions that are above a given threshold. It then creates three distinct arrays dependent on whether the amino acid that has a base-pairing probability above the specified threshold is in the first, middle, or last position in the codon. I plan to integrate these two programs as a means to fulfill my current research objective. However, I am going to make large sections of code into subroutines as well as develop more dynamic methods of creating synonymous changes instead of hardcoding each possible codon into if-else statements. This week I am continuing to work on a program that will generate synonymous changes based on local base-pairing probabilities. Currently, my program can run and recognize Mfold inputs and outputs. My next goal is Rfold integration and, therefore, synonymous change generation.
This week I made synonymous changes to the first 100 nucleotides of a sequence when the local base-pairing probability was above 0.1. I repeated this 100 times. Next, I ran each of these 100 sequences (with different synonymous changes) through my program that determines the folding energy and averaged the results. Then, I put these sequences back into the original sequence and run these 100 sequences through my program and averaged the results as well. Finally, I repeated this process for sequences of length 50 and 25 and created a graph (below) to represent the data. It is important to note that I made the synonymous changes on the same (first) 100/50/25 nucleotides of the sequence and not on random pieces throughout the sequence. I also reverted back to the original piece when making modifications instead of keeping changes that minimized the folding energy. My next experiment will take random pieces throughout the sequence and will put the modified piece back if the changes are advantageous.
This experiment took a great amount of time and effort. I had to make synonymous changes by hand and run my program more than 400 times. To minimize both the workload and time, another research student and are working on developing a program that can generate synonymous changes based on a local base-pairing probability specified by the user, given a Rfold output file. This week I have been continuing my folding energy experiment. After my initial experiment, I have been repeating it about 100 more times. After I am finished I will average these results together. Next, I will repeat this experiment but change the threshold from greater than or equal to 0.1 to several different thresholds and repeat those experiments 100 times and average the results. Then, I will create a graph based on my results to show the effect of base-pairing probabilities on folding energy. Currently, I plan to either use GNU Plot or Microsoft Excel to generate the graphs.
I also plan to modify the length of the selected modified sequence from 100 to 75, 50, and 25. I will repeat each experiment 100 times respectively and also plan to generate graphs to visually represent the resulting data. Within the past week, I have finished my Perl program (for now) that runs Mfold and calculates and directly outputs the folding energy. Using this program, I calculated the energy of a specific sequence and got ∆G=-41. Next, I took the first 100 nucleotides and calculated the folding energy for this piece and got ∆G=-5.2. Then, I used Rfold to calculate the local base pairing probabilities for the 100 nucleotide piece and made synonymous changes that involved the nucleotides with a probability greater than 0.1. I ran this modified 100 nucleotide sequence through my Mfold Perl program and found that the folding energy changed to -13.8 now. Finally, I put this modified sequence back into the original whole sequence and recalculated the folding energy and found that ∆G=-38.4. The results are shown in the table below.
Now I plan to repeat this experiment several times (~100) to see how consistent my results are. After I do this, I will modify the threshold as well as the size of the piece and see how these changes affect my results. I also plan to repeat these experiments several times. |
JAY VillariUndergraduate student studying Computer Science and Biology at The College of New Jersey Archives
May 2016
Categories |